Core Web Vitals: A Plain English Guide for 2026
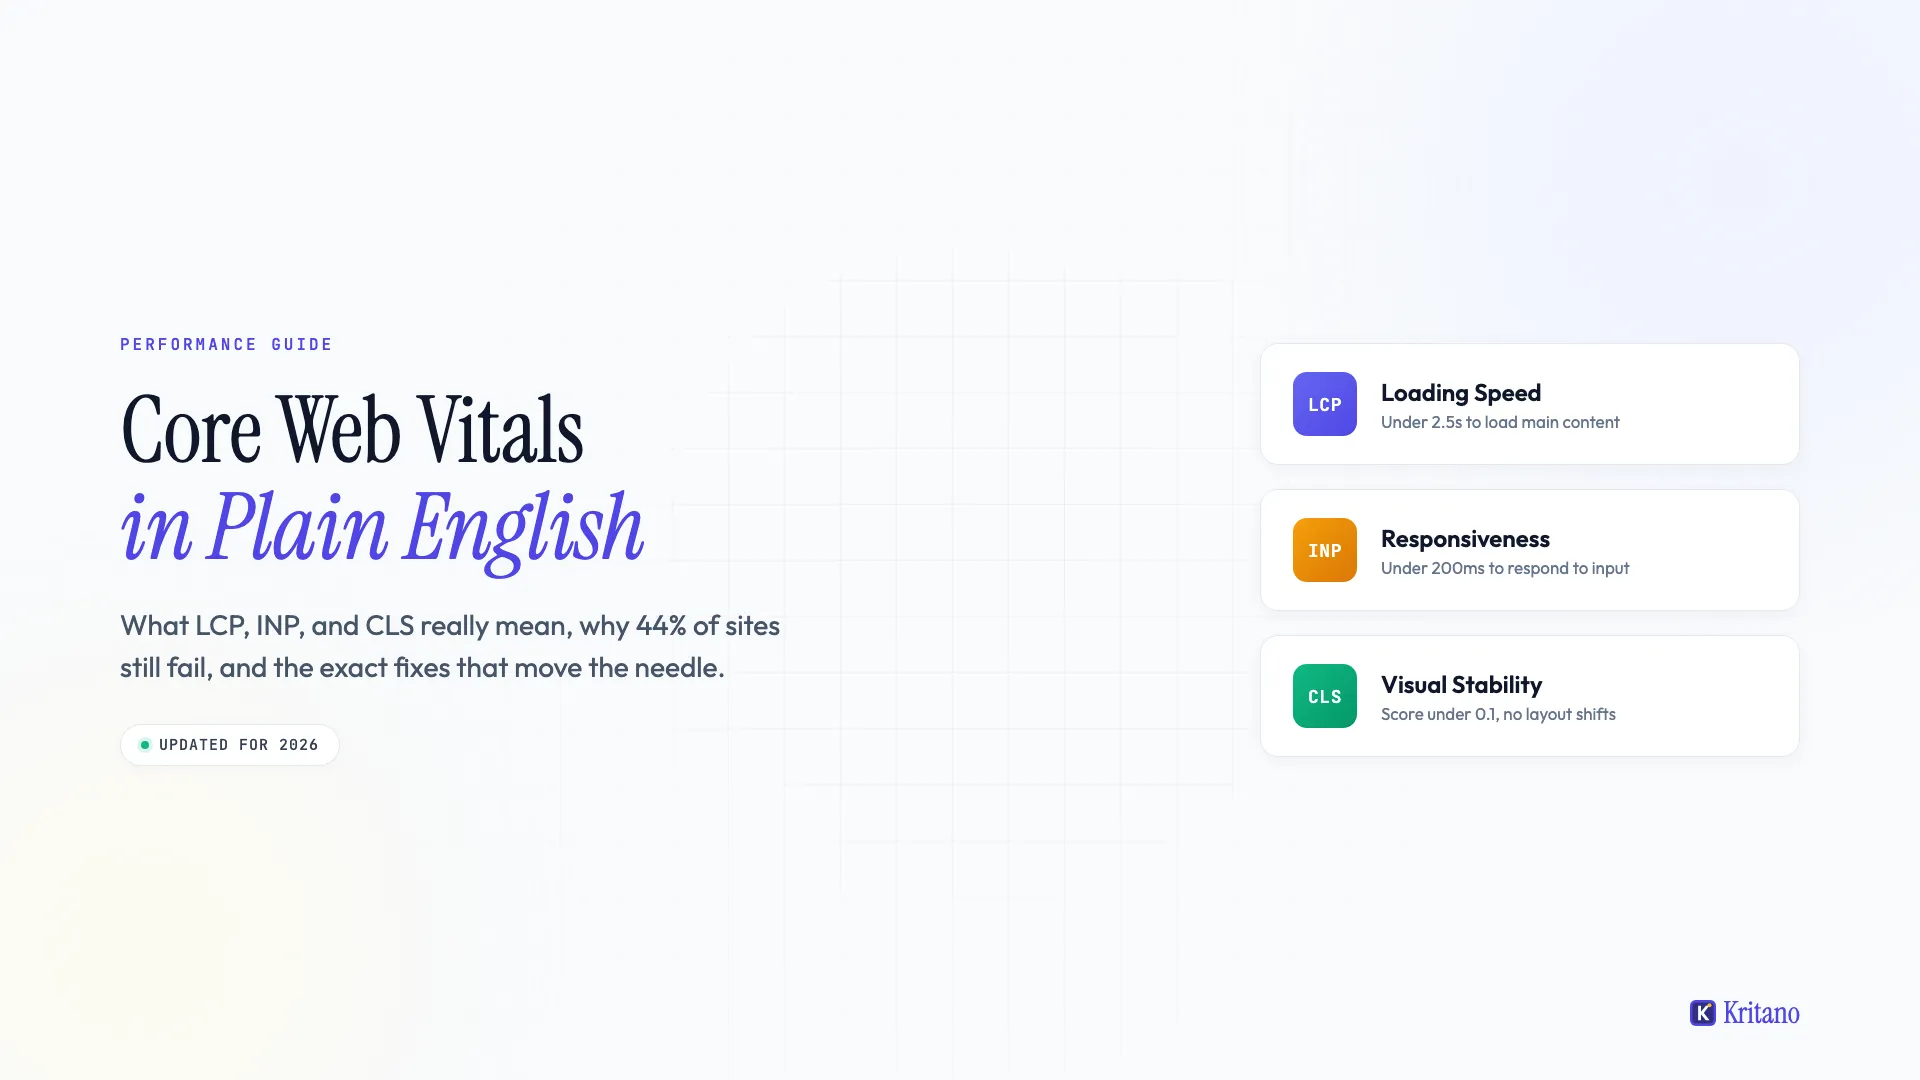
Core Web Vitals are three numbers Google uses to score the real-user experience of every page on the web. Pass all three, and your page is officially "good". Fail one, and you join the 44% of sites Google says are still under the line, with the ranking penalty and the bounce-rate problem that comes with it.
This guide explains what each metric measures, why most sites fail, and the exact fixes that move the score in 2026. No jargon, no hand-waving. By the end you will know what to measure, what to fix first, and what to ignore.
Contents
- What Core Web Vitals actually are
- The three metrics in 60 seconds
- Why most websites still fail
- How to measure your scores (and which tools to trust)
- Fixing Largest Contentful Paint (LCP)
- Fixing Interaction to Next Paint (INP)
- Fixing Cumulative Layout Shift (CLS)
- What changed in 2024-2026
- The audit workflow that actually works
- Frequently asked questions
1. What Core Web Vitals actually are
Core Web Vitals are three real-user metrics Google uses as a ranking signal and a UX scorecard. They measure how fast your page loads, how quickly it responds to clicks and taps, and how stable the layout is while it renders.
Google introduced the Core Web Vitals programme in 2020 as part of its broader Page Experience signal. They became a confirmed ranking factor in 2021. The third metric was swapped from First Input Delay (FID) to Interaction to Next Paint (INP) in March 2024, and that change is the single biggest reason a lot of sites that used to pass now fail.
The thing most people miss: Core Web Vitals are scored on real user data, not on your developer's laptop. Google measures the page experience of actual visitors in Chrome and aggregates it across the trailing 28 days. That field data is what drives the ranking signal. Lab data from PageSpeed Insights is useful for debugging but is not what gets scored.
To pass, your site needs 75% of mobile page loads, across all measured visitors, to hit the "good" threshold on every metric. Not the median. The 75th percentile. A site that's lightning-fast for half its users but unusable for the other half does not pass.
2. The three metrics in 60 seconds
The three Core Web Vitals each measure a different stage of the page experience:
- Largest Contentful Paint (LCP) measures how long it takes for the largest visible element to render. Targets: under 2.5s good, 2.5-4.0s needs improvement, over 4.0s poor.
- Interaction to Next Paint (INP) measures how quickly the page responds to user input, taking the worst-case interaction over the page's lifetime. Targets: under 200ms good, 200-500ms needs improvement, over 500ms poor.
- Cumulative Layout Shift (CLS) measures how much content unexpectedly moves around while loading. Targets: under 0.1 good, 0.1-0.25 needs improvement, over 0.25 poor.
Each metric maps to a real user frustration. LCP fails when a visitor clicks a result, stares at a blank screen, and goes back. INP fails when they tap a button and nothing happens for a beat. CLS fails when they go to tap an article link and an ad slides in underneath, sending them to a payday loan site.
Pass all three at the 75th percentile and Google labels your page "good". Fail one and the whole page is "poor".
3. Why most websites still fail
Only 56% of websites pass Core Web Vitals on mobile as of early 2026, according to the HTTP Archive's Web Almanac. The remaining 44% fail on at least one metric. The culprits are surprisingly consistent.
The four causes that explain most failures:
- Unoptimised images above the fold. A 3MB hero image is the single most common LCP killer. The browser cannot finish rendering until it has the hero, and on a 4G connection a 3MB image takes 4-6 seconds to arrive.
- Render-blocking JavaScript. Third-party scripts (analytics, chat widgets, tag managers, A/B testers) loaded synchronously in the head delay everything else. Each blocking script is paid for twice: once in load time and once in main-thread time, which then breaks INP.
- Missing image dimensions. Images without explicit
widthandheight(or anaspect-ratioCSS value) cause layout shift when they finally load. This is the easiest CLS failure to fix and the most common. - Bloated frameworks and unbounded bundles. Sites built on a heavy stack with no code-splitting routinely ship 500KB+ of JavaScript to render a simple article page. The browser has to download it, parse it, and execute it before INP becomes acceptable.
The fix patterns are well-understood. The reason failures persist is that performance work is treated as an "after launch" task, not a release gate. Once a site is in production, performance regressions accumulate quietly and nobody notices until rankings drop.
4. How to measure your scores (and which tools to trust)
There are four tools worth using, in this order:
Google Search Console > Page experience. This is the canonical source. It shows your real user (field) data for mobile and desktop separately, with a breakdown of which URLs are passing, needing improvement, or failing. If you only check one tool, check this one. It is what Google actually uses to score you.
PageSpeed Insights. Combines real-user field data with a synthetic lab test. The field data section ("Discover what your real users are experiencing") is what matters. The lab section is useful for one-off debugging but does not match the field score and should not be optimised for in isolation.
Chrome's built-in CrUX dashboard. The Chrome User Experience Report exposes the same field data Google ranks on, with a longer historical view. Useful for tracking the impact of fixes over the 28-day rolling window.
WebPageTest. Lab tool. Best for debugging a specific page in detail, especially for understanding the waterfall of resources and where the blocking time is going. Pair it with the field data, not in place of it.
Avoid optimising purely against Lighthouse or PageSpeed Insights' lab score. They run a single synthetic test on a throttled network simulator, which can be wildly different from your actual user experience. A site that hits 100 in Lighthouse can still fail Core Web Vitals at the 75th percentile of real users, because lab tests do not replicate device variance, network variance, or third-party script behaviour.
5. Fixing Largest Contentful Paint (LCP)
To fix LCP, identify which element is the LCP element on your page, then make it arrive faster. Use Chrome DevTools' Performance panel to see exactly which element it is. On 80% of marketing pages, it is the hero image.
The five fixes that move LCP most reliably:
Preload the hero image.
<link rel="preload" as="image" href="/images/hero.webp"
      imagesrcset="/images/hero-small.webp 600w, /images/hero.webp 1200w"
      imagesizes="100vw" />
This tells the browser to start downloading the LCP image before the HTML parser has even reached it. Combined with fetchpriority="high" on the actual <img> tag, this is usually worth a 300-800ms LCP improvement.
Serve modern image formats. WebP and AVIF are 25-50% smaller than equivalent-quality JPEGs. Use a <picture> element with format fallbacks. If your CMS or CDN can serve formats per Accept header, even better.
Inline critical CSS. The browser cannot render anything until it has parsed enough CSS to know how to lay out the LCP element. Inline the CSS needed for the above-the-fold render directly in <head> and load the rest asynchronously. Tools like Critical or Penthouse can extract this automatically.
Move fonts off the critical path. Custom web fonts can block text render and (depending on the LCP element) the LCP itself. Use font-display: swap, preload the font file with <link rel="preload" as="font">, and reduce the number of weight variants.
Get the page to the user faster (Time to First Byte). If your TTFB is over 800ms, no amount of optimisation downstream will save you. Look at CDN caching, edge rendering, or server-side response time. Static site generation or full-page caching at the edge often shaves 500-1500ms.
The order of operations matters. Preload + format conversion usually delivers the fastest win for the lowest effort.
6. Fixing Interaction to Next Paint (INP)
INP measures how quickly your page responds to user input, and it is the metric that exposes how bloated your JavaScript actually is. Unlike LCP, INP samples the worst-case interaction across the entire page session, not just the initial load.
The three patterns that wreck INP:
Long tasks blocking the main thread. Any JavaScript task longer than 50ms blocks the browser from responding to clicks and taps. Tag managers, analytics callbacks, and React hydration are the most common culprits. Open Chrome DevTools, record an interaction, and look for the red "long task" bars. Each one is a candidate for splitting or deferring.
Heavy event handlers. A click handler that runs a 200ms function will give you a 200ms INP for that interaction. Move expensive work off the main thread with requestIdleCallback, setTimeout, or a Web Worker. For React apps, use useTransition and useDeferredValue to mark non-urgent updates.
Third-party scripts re-running. Tag managers and consent banners often fire on every interaction. Audit your third-party stack: each script costs you main-thread time on every click. The fastest sites use only one or two third parties, and load them with async or defer.
The fix that moves INP fastest in practice: defer or remove third-party scripts. A single chat widget can add 100-200ms to INP all by itself. Removing one is often worth more than a week of micro-optimisations to your own code.
7. Fixing Cumulative Layout Shift (CLS)
CLS is the easiest Core Web Vital to fix once you find the offending element. It is also the most user-visible: a single layout shift mid-scroll is the kind of thing that gets a site rage-quit.
The four reliable CLS fixes:
Set explicit dimensions on every image and embed. Add width and height attributes (or an aspect-ratio CSS value) to every <img>, <iframe>, <video>, and ad slot. The browser uses these to reserve space before the asset loads, so nothing shifts when it arrives.
<!-- Fail -->
<img src="/hero.jpg" alt="Hero">

<!-- Pass -->
<img src="/hero.jpg" alt="Hero" width="1200" height="630">
Reserve space for ads, embeds, and dynamic content. If your page injects an ad, an embedded tweet, or a "you might also like" widget, give it a fixed container with explicit dimensions. The asset can then load into the reserved slot without pushing surrounding content.
Avoid inserting content above existing content. Cookie banners, "subscribe to our newsletter" pop-ups, and notification bars that animate in from the top push the entire viewport down. Either reserve space for them at page load or use an overlay positioned absolutely so they do not displace flow content.
Pre-load custom fonts. Font-swapping causes layout shift when the fallback font is wider or narrower than the custom font. Preload the custom font and pair it with a fallback that is metrically similar (or use the new CSS size-adjust property to match them).
Fix the dimensions first. It accounts for 80% of CLS failures and takes one line per image.
8. What changed in 2024-2026
The Core Web Vitals programme has evolved since launch. The three changes worth knowing about:
INP replaced FID in March 2024. First Input Delay measured only the very first interaction on the page, and most pages passed it easily because the first click usually happens before any JavaScript work begins. INP samples every interaction and reports the worst-case (or the 98th percentile for pages with many interactions). The result: a lot of sites that comfortably passed FID now fail INP, and the fix patterns are different. Sites with heavy single-page-app frameworks have been hit hardest.
Mobile-first scoring is the default. Google ranks against the mobile field data, not the desktop one. A site that aces desktop and limps on mobile is treated as a poor experience. This is a clarification, not a change, but it surprises a lot of operators who only ever test from their laptop.
Soft-navigation tracking is being trialled. For sites built as single-page apps, the historical problem was that route changes did not trigger a new CWV measurement, so the in-app navigation experience was invisible to Google. Chrome is rolling out support for measuring CWV across soft navigations, which will surface SPA performance issues that have been hiding for years. If your site is a React or Vue SPA, expect the field data picture to get worse before it gets better.
A fourth change to watch: there has been public discussion about adding a fourth Core Web Vital around responsiveness during scrolling, sometimes called "Scroll INP" or similar. Nothing official yet, but if you are already optimising for INP, the work translates directly.
9. The audit workflow that actually works
The pattern that produces durable improvements rather than one-off wins:
- Establish the baseline. Pull Google Search Console's Page experience report and write down today's pass rate for mobile. This is the number you are trying to move.
- Identify the worst-performing URL group. Search Console groups URLs by behaviour. Focus on the largest group that is failing, not your homepage. Your homepage is probably already fast.
- Pick the worst-performing metric for that group. Fix one metric at a time. Fixing all three in parallel makes it impossible to attribute the improvement.
- Apply the highest-leverage fix from the relevant section above. For LCP that is usually image preload + WebP. For INP it is usually defer the slowest third party. For CLS it is usually explicit image dimensions.
- Wait 28 days. Field data updates on a 28-day rolling window. Lab tests will improve immediately; the field score takes time. Plan for this.
- Re-measure and repeat. Cycle through the failing URL groups until the overall pass rate crosses 75%.
- Add a regression check to your release process. Run a lab test on the homepage and one heavy page on every deploy. Fail the build if either drops below the threshold.
Most teams skip step 7. The result is that performance work becomes a quarterly fire-fighting exercise instead of a steady-state property. Add the regression check to CI, and you stop losing ground every time someone ships a new analytics tag.
If you want a printable version of the full pre-launch audit (Performance, Accessibility, SEO, Security, Content Quality, and AI Readiness across 85 checks), we have packaged it into a one-page reference: The Website Health Checklist. Use it as the manual companion to whatever automated scanner you run.
A complete audit covers more than CWV. Performance is one of six pillars of website health and ignoring the rest leaves money on the table. But if performance is where you are starting, this guide is the right ground.
10. Frequently asked questions
What's a good Core Web Vitals score?
A page passes when 75% of mobile page loads, measured across the trailing 28 days, hit the "good" threshold on all three metrics. The thresholds are LCP under 2.5s, INP under 200ms, and CLS under 0.1. Anything else is "needs improvement" or "poor". Google ranks "good" pages favourably and treats the rest as degraded experiences.
Are Core Web Vitals a Google ranking factor?
Yes. Core Web Vitals have been confirmed as a ranking factor since 2021, as part of Google's Page Experience signal. The impact is real but modest: a passing page outranks a failing page only when other ranking factors are roughly equal. CWV will not save weak content from being out-ranked by stronger content. It will, however, be the tiebreaker when two similar pages compete for the same query.
What's the difference between lab data and field data?
Lab data is a synthetic test run on a single device, on a throttled connection, in a controlled environment. It is what PageSpeed Insights and Lighthouse produce. Field data is the real measurement Google takes from actual Chrome users over the trailing 28 days. Field data is what ranks you. Lab data is a debugging aid that approximates it. They often disagree because lab tests do not replicate device variance or third-party script timing.
Do Core Web Vitals matter for mobile and desktop differently?
Yes. Google's mobile-first index ranks based on the mobile field data. A site that passes desktop but fails mobile is treated as failing. Most sites that fail Core Web Vitals fail on mobile while passing on desktop, because the mobile network and CPU are slower, the screen is smaller, and the same hero image takes longer to render. Always check the mobile column in Search Console first.
How long does it take for CWV improvements to affect rankings?
The field data Google uses updates on a 28-day rolling window. A fix shipped today starts to influence the score immediately but only fully reflects in the field data after 28 days of real user traffic. The ranking impact, if any, follows from there. Plan to ship fixes, wait a month, and measure. Anything faster is impossible to attribute. Anything slower suggests the fix did not actually land for real users.
Where to go next
Pick one metric, find the worst-performing URL group, fix the highest-leverage thing, and wait 28 days. That is the whole programme. The 85-check Website Health Checklist covers the Performance pillar in full and the other five pillars too, so the wins compound across categories.
For a deeper read on why most sites still fail and what the trend line looks like, see Only 56% of Websites Pass Core Web Vitals. For the short-form version of this guide, see Core Web Vitals in Plain English.
Or run a Kritano scan on your domain and get any Kritano plan at 50% off forever! The performance audit catches every check in this guide automatically and reports the field data alongside it, so you can see where you are versus where the field thinks you are.

Founder of Kritano
5 years in web development. I specialise in web auditing, WCAG 2.2 compliance, and search engine optimisation.
I built Kritano after years of running audits with fragmented tools. I write about SEO, accessibility, security, and performance based on real auditing data from thousands of scans.