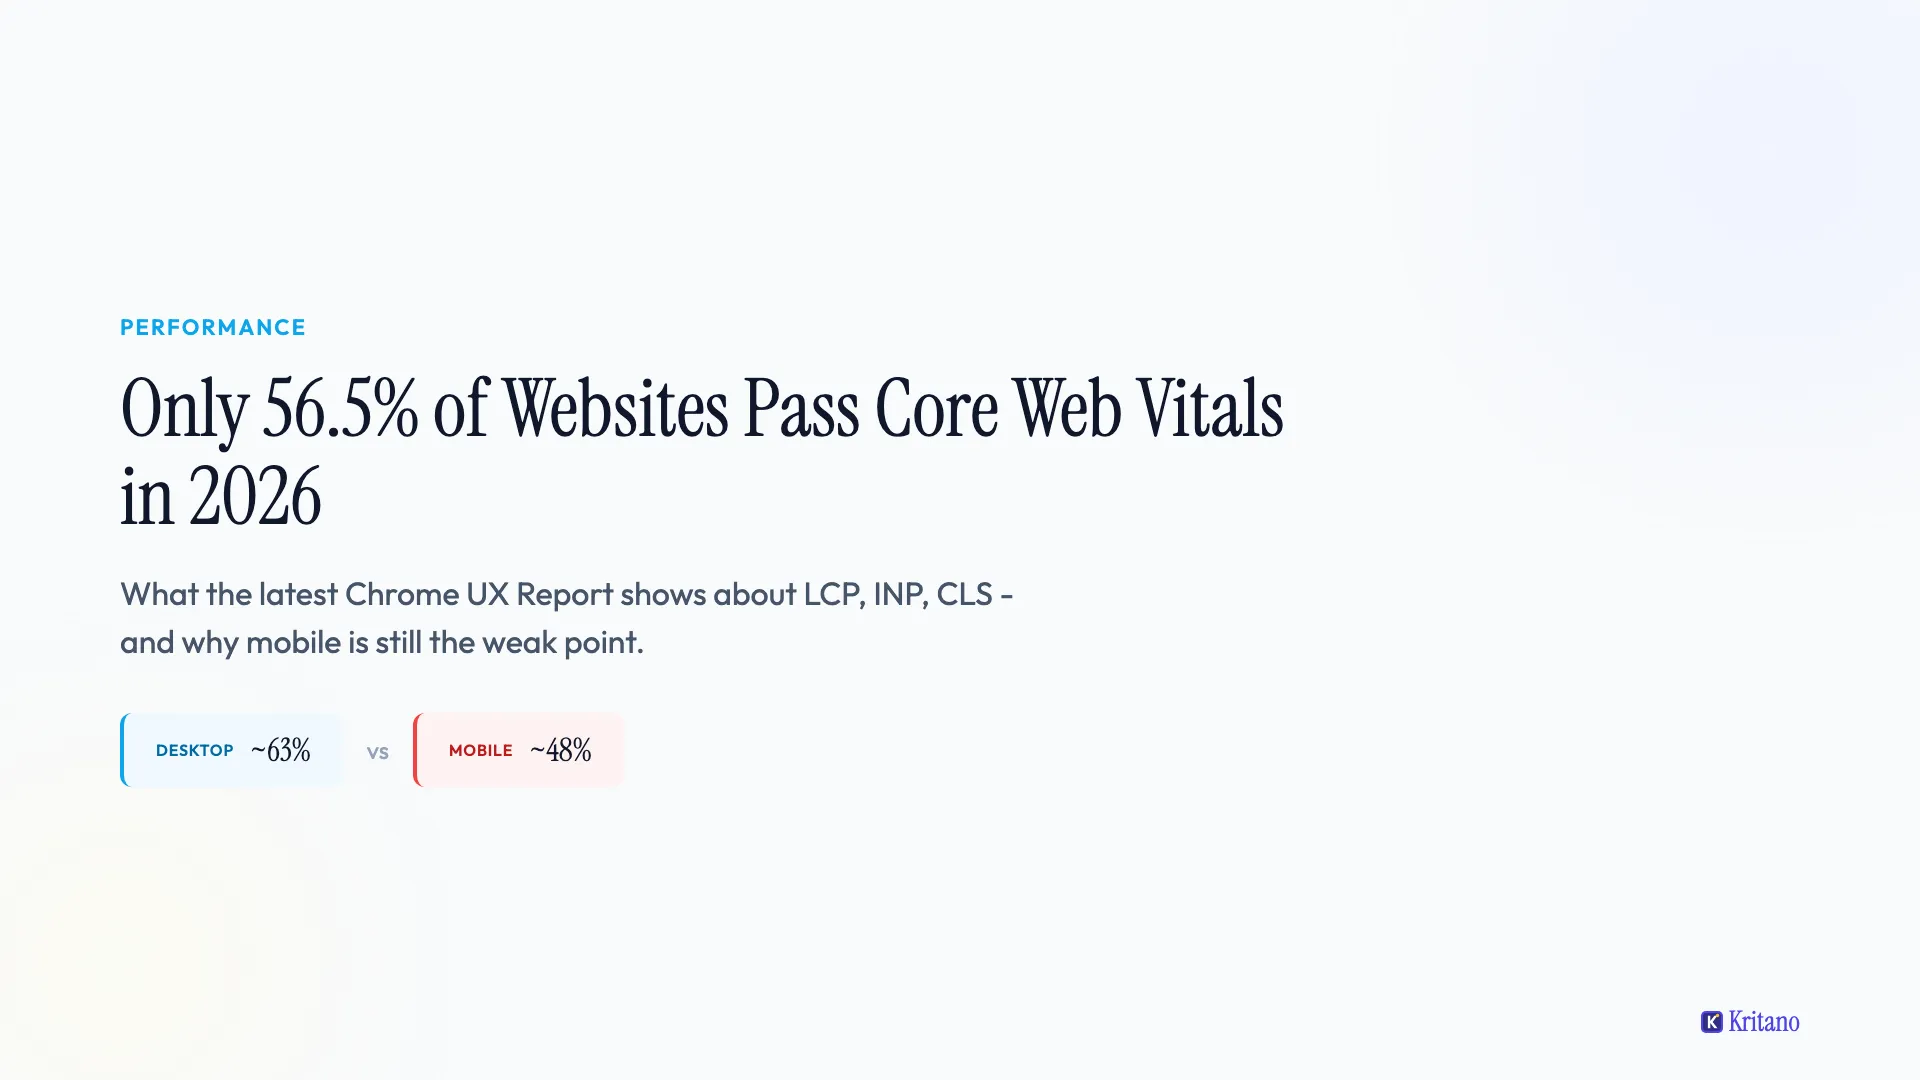
Only 56.5% of Websites Pass Core Web Vitals
Here's What the Latest Data Shows
Google has been pushing Core Web Vitals as a ranking factor for years now. The March 2026 core update made them weigh even more heavily. So how is the web actually performing?
Not great, if we're honest.
The latest Chrome UX Report, published on April 14, 2026, shows that just 56.5% of origins have good Core Web Vitals overall. That's up 1.3% from the previous month - progress, but glacially slow. Nearly half the web is still failing the metrics Google uses to evaluate user experience.
What the Numbers Actually Say
The Chrome UX Report (CrUX) measures real-world performance from actual Chrome users. This isn't lab data from a test environment - it's what people actually experience when they visit websites. Here's where things stand as of the April 2026 release:
| Metric | Pass Rate | Change |
|---|---|---|
| LCP (Largest Contentful Paint) | 69.0% | Up 1.1% |
| CLS (Cumulative Layout Shift) | 81.2% | Down 0.1% |
| INP (Interaction to Next Paint) | 87.2% | Flat |
| Overall CWV | 56.5% | Up 1.3% |
To pass overall, a site needs to hit "good" on all three metrics simultaneously. That's why the overall rate (56.5%) is much lower than any individual metric - you only need to fail one to fail the lot.
Why LCP Is the Bottleneck
LCP is the weakest link at 69%. It measures how quickly the largest visible content element loads - usually a hero image, heading, or video. Nearly a third of websites are failing this one metric alone.
The usual culprits are uncompressed images, render-blocking JavaScript, and slow server response times. These aren't exotic problems. They're the basics, and most sites still haven't addressed them.
The March 2026 core update tightened things further. Google now evaluates Core Web Vitals at a site-wide level, not page-by-page. If more than 25% of your URLs score "Poor" or "Needs Improvement" on any single metric, your entire domain takes the hit. You can't just optimise your homepage and call it done anymore.
The Mobile Gap Is the Real Story
The headline numbers mask a significant split between desktop and mobile performance. Desktop pass rates sit around 63%, but mobile drops to roughly 48%. Less than half of mobile websites pass Core Web Vitals.
This matters because mobile now accounts for the majority of web traffic. If you're only testing performance on your desktop machine, you're looking at the wrong numbers. Your actual users are on phones with less processing power, slower connections, and smaller screens.
Google uses mobile-first indexing, which means the mobile version of your site is what gets evaluated for rankings. A site that scores well on desktop but fails on mobile is failing where it counts.
INP Replaced FID - And Most Sites Haven't Noticed
One of the bigger shifts in 2026 was the replacement of First Input Delay (FID) with Interaction to Next Paint (INP). FID only measured the delay on the first user interaction. INP measures every interaction - clicks, taps, keyboard input - and reports the slowest one.
The good news: 87.2% of origins pass INP, making it the strongest of the three metrics. The bad news: this high pass rate masks the fact that many sites haven't actually optimised for INP at all - they just happen to pass because their JavaScript isn't heavy enough to cause problems yet. As sites add more interactivity, INP will become a bigger challenge.
The "good" threshold for INP dropped from 200ms to 150ms with the March 2026 update. Sites that were borderline under the old threshold may now be failing.
What Google's March 2026 Update Changed
The March 2026 core update made several things harder to ignore:
- Site-wide assessment - CWV are now aggregated across your entire domain, not evaluated page-by-page
- Equal metric weighting - LCP, INP, and CLS now carry equal weight as ranking signals. A poor INP score hits you as hard as a poor LCP score.
- Tighter thresholds - INP "good" dropped from 200ms to 150ms
- Stronger ranking impact - sites with poor CWV saw traffic drops of 20-35% according to early data from tracking tools
Performance has gone from a soft signal to a hard ranking factor. If your Core Web Vitals are poor, even high-quality content can struggle to rank.
What You Can Do About It
Check where you actually stand
Don't guess. Run a website audit that includes performance metrics. Check your CWV scores for both desktop and mobile - the mobile scores are the ones that matter for rankings.
Kritano's performance pillar checks LCP, INP, and CLS alongside image optimisation, render-blocking resources, and caching configuration. One scan covers the lot.
Fix the quick wins first
The three changes that move the needle most:
- Compress and resize images - uncompressed hero images are the #1 cause of slow LCP. Convert to WebP, resize to the actual display dimensions, and lazy-load anything below the fold.
- Defer non-critical JavaScript - render-blocking scripts delay everything. Move non-essential JS to
deferorasync, and consider whether you actually need every third-party script you're loading. - Set cache headers - static assets (images, CSS, JS) should have long cache lifetimes. This won't help first-visit performance, but it dramatically improves repeat visits.
Test on real devices
Stop testing only on your development machine. Use Chrome DevTools with CPU throttling set to "low-tier mobile" to simulate what your actual users experience. The median phone is 3-9x slower than a developer's laptop.
Make it routine
Performance degrades over time. New scripts get added, images get uploaded at full resolution, plugins update and introduce regressions. A one-off performance fix doesn't last. Schedule regular audits - monthly is ideal - so problems get caught before they compound.
Frequently Asked Questions
What are Core Web Vitals?
Core Web Vitals are three metrics Google uses to measure real-world user experience on websites: LCP (loading speed), INP (responsiveness), and CLS (visual stability). They are a confirmed ranking factor in Google Search.
What percentage of websites pass Core Web Vitals in 2026?
As of April 2026, 56.5% of origins have good Core Web Vitals overall according to the Chrome UX Report. Desktop pass rates are around 63%, while mobile sits at roughly 48%.
What is a good LCP score?
A good LCP score is under 2.5 seconds. The April 2026 CrUX data shows 69% of origins achieve this. LCP measures how quickly the largest visible content element (usually a hero image or heading) loads on the page.
What replaced FID in Core Web Vitals?
Interaction to Next Paint (INP) replaced First Input Delay (FID) in 2026. Unlike FID which only measured the first interaction, INP measures the responsiveness of every user interaction on the page. A good INP score is under 150ms (tightened from 200ms in the March 2026 update).
Do Core Web Vitals affect SEO rankings?
Yes. Google's March 2026 core update increased the weight of Core Web Vitals as a ranking signal. Sites with poor CWV scores have seen measurable traffic drops of 20-35%. CWV are now assessed at a site-wide level, not page-by-page.
My Take
The 56.5% overall pass rate tells me the web is getting better at performance, but painfully slowly. A 1.3% month-on-month improvement means it'll take years before a comfortable majority of sites pass.
The mobile gap is the real concern. Most web traffic is mobile, most e-commerce is mobile, and Google ranks based on mobile performance. Yet less than half of mobile sites pass CWV. That's a massive opportunity for anyone willing to take performance seriously - and a real risk for anyone who isn't.
In my honest opinion, performance auditing shouldn't be an afterthought. It should be part of every website audit alongside SEO, accessibility, security, and content quality. The sites that treat all of these as a system - not isolated checklist items - are the ones that consistently outperform.
If you want to see where your site stands across all of these, join the waitlist and get ready. It takes less than two minutes.

Founder of Kritano
5 years in web development. I specialise in web auditing, WCAG 2.2 compliance, and search engine optimisation.
I built Kritano after years of running audits with fragmented tools. I write about SEO, accessibility, security, and performance based on real auditing data from thousands of scans.